How to create a signal that frequence changes in time
井民全, Jing, mqjing@gmail.com
ETA: 5 min
Back to the Main Page
Download: notebook
Google doc: This Document
Purpose
這篇文章教你理解如何建立一個 chirp 訊號類別, 理解如何製造一個頻率隨時間改變的訊號.
Fig. The cos(2π f(t) t) signal in time 1 sec.
Definition
- Phase is the position of a point in time on a wavefrom cycle. When frequency is constant, the phase,
, increases linearly over time,
= 2π f t.
Key
- 重點就是如何回傳 evaluate function 的 ys 值.
- 因為 frequency 隨時間改變, 所以在建立訊號時, 要
- Step 2: [計算 phase] 累積遞增每個單位 phase, 取得 phase 陣列
- Step 3: [計算 amplitude] 得到了 sample point 在時間 axis 上的位置, 根據 phase 計算 signal 的 amplitude.
Usage
signal = Test2(start=10, end=200) # 產生 signal, 給定頻率 從 10 到 200
# 測試聲音
wave1 = signal.make_wave(duration=4) # 建立 4 秒鐘,波形
wave1.make_audio()
|
Fig. A audio control for play the chirp signal.
# 畫出波形檢視
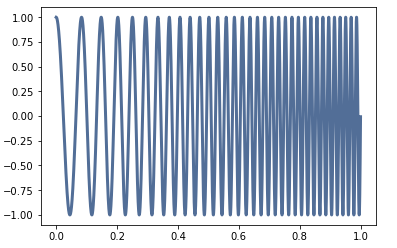
wave1.segment(start=0, duration=1).plot() # 只看 1 秒鐘這範圍的波形 y
|
Fig. Show the customized signal for 1 second
Show me the code
from __future__ import print_function, division
%matplotlib inline
import thinkdsp
import thinkplot
import numpy as np
import warnings
warnings.filterwarnings('ignore')
from ipywidgets import interact, interactive, fixed
import ipywidgets as widgets
from thinkdsp import Signal
import math
class Test2(Signal):
def __init__(self, start, end, amp=1.0):
self.start = start
self.end = end
self.amp = amp
def evaluate(self, ts):
# ts maybe very tinny (ts 在畫圖的時候, 會自動給值)
# Create a data list for recording the frequency for each interval in time
freqs = np.linspace(self.start, self.end, len(ts) - 1)
# Step 1: Setup the phase (the position of a point in time on a wavefrom cycle)
# Since the frequence is variance in time, we should calcuate the phase
# for each interval, individually.
dts = np.diff(ts) # (a) 取得 ts 陣列 : Get the time intervals in time
dps = math.pi * 2 * freqs * dts # (b) 計算每個時間間隔的單位 phase 陣列
#(有可能間隔不是固定, 所以分別計算每個間隔 dts,
# 所對應的 phase)
# Calcuate the individual phases for each interval
phases = np.cumsum(dps) # (c) 累積每個單位 phase, 取得 phase 陣列
# Accumuate the individual phases to form the
# phrases in time for a wavefrom
# Step 2: Setup the amplitude
ys = self.amp * np.cos(phases) # Calcuate the amplitude sequence for given phases
return ys
signal = Test2(start=10, end=200) # 產生 signal, 給定頻率 從 10 到 200
# 測試聲音
wave1 = signal.make_wave(duration=4) # 建立 4 秒鐘,波形
wave1.make_audio()
wave1.segment(start=0, duration=1).plot() # 只看 1 秒鐘這範圍的波形 y
|