How to implement a lowpass filter using ThinkDSP
井民全, Jing, mqjing@gmail.com
Back to the Main Page
Command
spectrum.low_pass(3000)
|
Code
from __future__ import print_function, division
%matplotlib inline import thinkdsp import thinkplot import numpy as np #import warnings #warnings.filterwarnings('ignore') from ipywidgets import interact, interactive, fixed import ipywidgets as widgets from IPython.display import display
# Load the wave
wave=thinkdsp.read_wave('92002__jcveliz__violin-origional.wav')
wave.make_audio() // verification step
# Get the Segment
start = 1.2
duration = 0.6
segment = wave.segment(start, duration)
segment.plot()
thinkplot.config(xlabel='Time (s)')
# Wave provides make_spectrum, which computes the spectrum of the wave.
spectrum = segment.make_spectrum()
spectrum.plot()
thinkplot.config(xlabel='Frequency (Hz)')
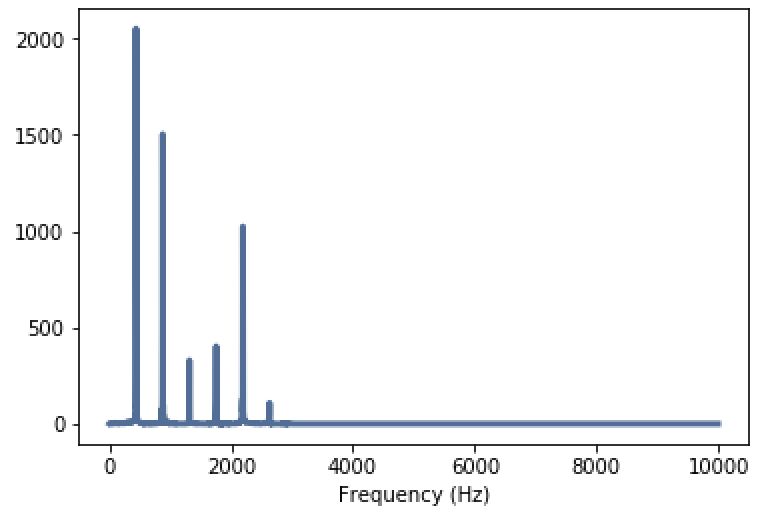
spectrum.low_pass(3000)
spectrum.plot(high = 10000)
thinkplot.config(xlabel='Frequency (Hz)')
|
E.g.
Spectrum to wave
filtered = spectrum.make_wave()
filtered.normalize() # normalize to the range -1 to 1.
filtered.apodize()
|
More Information
File -> Wave
wave=thinkdsp.read_wave('92002__jcveliz__violin-origional.wav')
wave.make_audio()
|
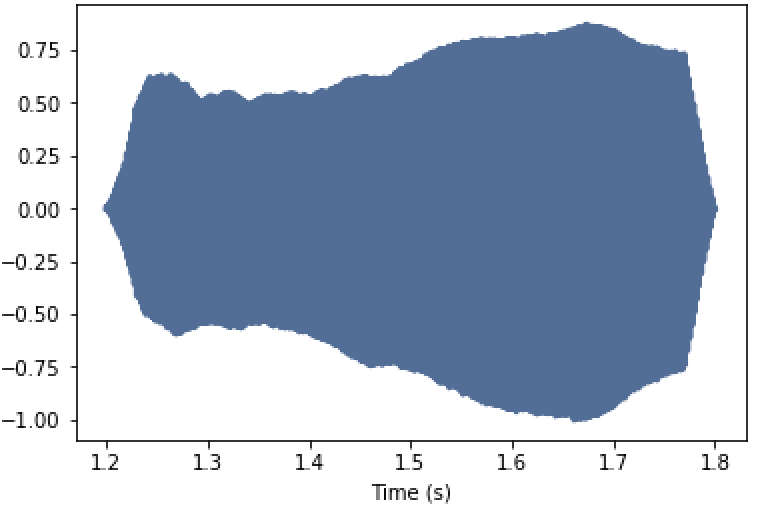
Wave -> Segment (wave)
start = 1.2
duration = 0.6
segment = wave.segment(start, duration)
segment.plot()
thinkplot.config(xlabel='Time (s)')
|
Wave to spectrum
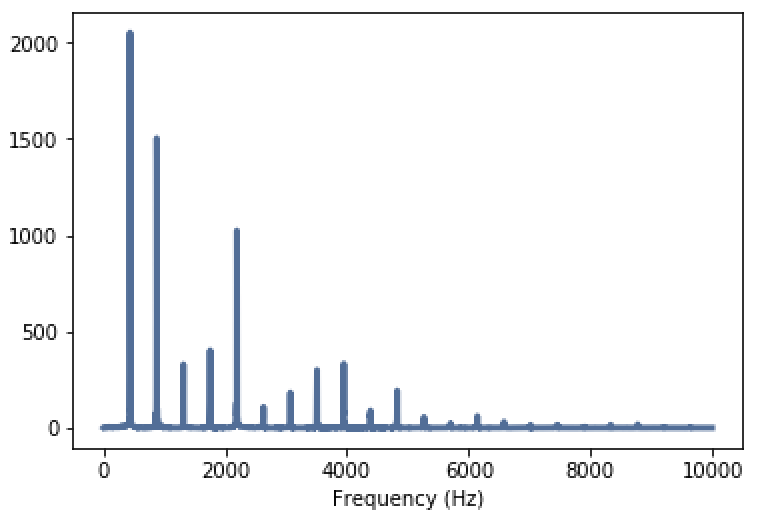
# Wave provides make_spectrum, which computes the spectrum of the wave.
spectrum = segment.make_spectrum()
spectrum.plot()
thinkplot.config(xlabel='Frequency (Hz)')
|

spectrum.plot(high = 10000)
Low Pass
spectrum.low_pass(3000)
spectrum.plot(high = 10000)
thinkplot.config(xlabel='Frequency (Hz)')
|
Spectrum to Wave
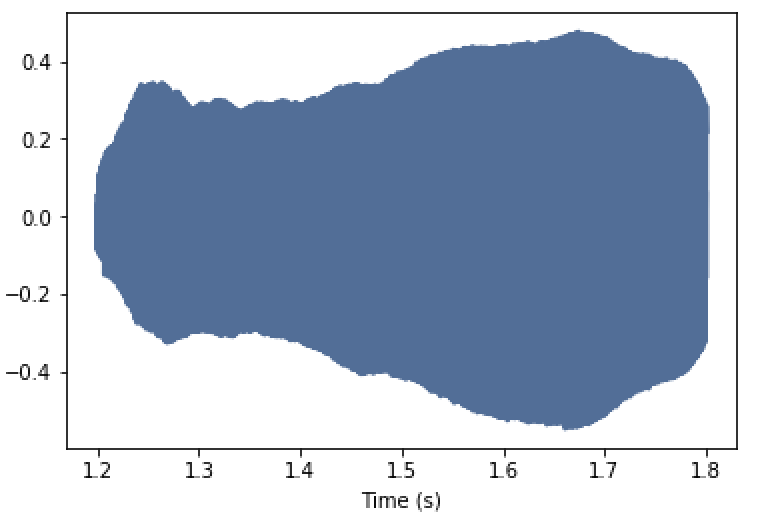
filtered = spectrum.make_wave()
filtered.normalize() # normalize to the range -1 to 1.
filtered.apodize()
filtered.plot()
thinkplot.config(xlabel='Time (s)')
|
Why Apodization?
An example of apodization is the use of the Hann window in the Fast Fourier transform analyzer to smooth the discontinuities at the beginning and end of the sampled time record.
Ref: Apodization
|
Original
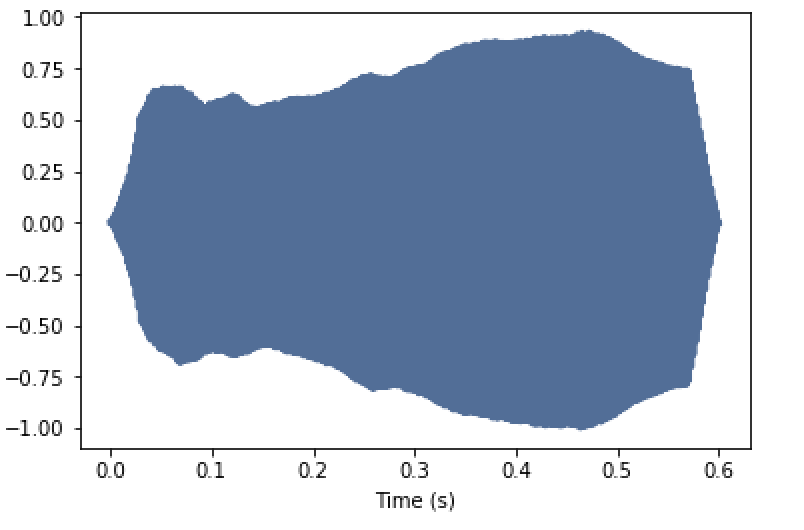
segment.normalize()
segment.apodize()
segment.plot()
thinkplot.config(xlabel='Time (s)')
|
Play segments
segment.make_audio()
filter.make_audio()